Baseball Between the Numbers: Why Everything You Know About the Game Is Wrong
The Baseball Prospectus (2006)
While a leadoff hitter and a #9 hitter may both find their RBI chances restricted by the mediocre batters hitting in front of them, the leadoff man will gain more chances simply by having more times at bat. Roughly speaking, for every lineup spot a player moves up, he gains twenty plate appearances over a full season. Thus, when the Yankees briefly toyed with the idea of putting the speedy but punchless Tony Womack in the leadoff spot in 2005, they were giving their worst hitter more chances to squelch potential rallies. (3, "What's the Matter with RBI?")
Studies have shown that a player who strikes out a lot isn't hurting his team by any significant margin versus a player who strikes out far less, assuming their other statistics are the same. Although a strikeout can't advance a runner the way a "productive" groundout or flyout can, a batter who doesn't make contact also can't ground into a double play. The benefit of the occasional runner advancement is canceled out by the cost of the double plays, making the strikeout, on average, no worse than other kinds of batting outs. But try telling that to a manager who's just watched his hitter swing and miss twelve times in a game. The bias against high-strikeout hitters remains alive and well, facts be damned. (9, "What's the Matter with RBI?")
One popular definition of an important plate appearance is a close and late situation: "In the 7th inning or later with the batting team either ahead by one run, tied or with the potential tying run at least on deck." This would define, for example, a situation in which the home team is batting with the bases empty, down by two runs, with two outs in the bottom of the ninth, as a clutch situation. But that isn't a tremendously important at-bat-the game is probably already lost at that point. Over the past decade, home teams facing this situation went on to win the game less than 1 percent of the time. However, home teams down by just one run with two outs and the bases empty in the bottom of the ninth didn't fare much better, winning the game just 2.3 percent of the time. Thus, even if the batter in the down-two situation hit a home run to close the deficit to one, he would improve his team's winning chances by only about 1 percent. By comparison, a home run to lead off the game in the top of the first inning improves a team's winning chances by about 9 percent—yet it would never be called a clutch hit. (16, "Is David Ortiz a Clutch Hitter?")
Third and most obvious, OBP is the most important variable—more important than SLG or AVG. Given any group of nine hitters, the batting order that scores the most runs is the one ranked in order of descending OBP. Give the hitters who make the fewest outs the most chances to bat, and you'll score more runs. (37-8, "Was Billy Martin Crazy?")
Protection is overrated. There's no evidence that having a superior batter behind another batter provides the initial batter with better pitches to hit; if it does, those batters see no improvement in performance as a result. Additionally, it's very rare that a situation arises in which run expectation drops after the pitching team walks the batter at the plate. Therefore, if the pitching team does walk a batter because it would rather pitch to the following man, it is almost always making a mistake by opening the door for a big inning. The situation changes late in close games as the importance of a single run begins to trump that of many runs, but even in those situations, the difference between the two batters would have to be extreme.
In short, most of the hand-wringing and scrutiny of batting orders is for naught. Batting order simply does not make that much difference. Managers tinkering with lineups so rarely shun convention that most of their changes would affect their teams' output by only a few runs over the course of a season. Sorting a lineup in descending order of OBP yields the most runs, but players with high SLG can offset a low OBP as early as third in the lineup. The conventional lineup's most egregious flaw is that it costs the game's best players about 18 PA per lineup spot per season. If Barry Bonds led off instead of hitting fourth, he would see about 54 more PA per year, adding perhaps 10 runs to the Giants' offensive output. Teams without a player of Bonds's caliber could gain about 10 runs (1 win) a year by routinely batting their players in order of descending OBP. Furthermore, managers worrying about protecting their best hitters need not fret. Situations in which the pitcher would gain by walking the initial batter to pitch to the following man are so rare that employing an optimal lineup order would eliminate nearly all of them. Intentionally walking any batter in a correctly ordered lineup is nearly always a bad decision.
So was Billy Martin crazy? Not, at least, with regard to his batting order. He understood that who is in the lineup is much more important than where they bat. Were it not that the conventional wisdom has become self-fulfilling prophecy—batting order is important because everybody thinks it's important—Martin could have pulled his lineups out of a hat all year long and hardly lost a game in the standings. (47, "Was Billy Martin Crazy?")
One of the earliest analyses of historical trends in pitcher usage was the landmark 1989 book The Diamond Appraised by Craig Wright and Tom House. The authors looked at pitchers of various ages and their workloads and discovered that young pitchers who pitched to a high number of batters per game seemed to get hurt more often. This was the beginning of the modern movement to monitor pitch counts.
In the mid-1990s, Baseball Prospectus's Rany Jazayerli was one of the first researchers to try to organize and codify what the mishmash of evidence on pitch counts was telling us; he summed it up in his principle of pitcher fatigue: Throwing is not dangerous to a pitcher's arm. Throwing while tired is dangerous to a pitcher's arm. (77, "Five Starters or Four?")
But throwing out the numbers completely is just as bad. Human memory is one of the worst data-collection devices in the world. In How We Know What Isn't So, Thomas Gilovich noted the many problems with human perception and analysis of everyday events. We find nonexistent patterns in random data, extrapolate from too little information, weight events that confirm our preconceptions vastly more than those that disagree with them, and eagerly accept secondhand information as fact. This is not to say that our eyes lie to us all the time, but there are inherent biases when people trust only their eyes. (96, "Did Derek Jeter Deserve the Gold Glove?")
But 2005 aside, the reason Jeter has hurt his team defensively is that he doesn't get to many balls and is not spectacularly efficient with those he does get to. Fans new to the game sometimes think his nick name is "Pastadiving" because they hear the phrase "past a diving Jeter" so often during Yankee broadcasts. He's consistently near the bottom of the league in chances, put-outs, and assists. Many of his flashy plays would be routine for a better defensive shortstop like Miguel Tejada or Rafael Furcal. (98, "Did Derek Jeter Deserve the Gold Glove?")
. . . Bill James's idea of a defensive spectrum. In its original version, moving from left to right in order of increasing difficulty, the spectrum looked like this:
1B—LF—RF—3B—CF—2B—SS—C
James determined the spectrum both from observation and from the tendencies of players to change positions later in their careers as their defense eroded. The Astros' Craig Biggio is a good example: He originally came up as a catcher, then moved to second and then outfield after the Astros signed Jeff Kent. Likewise, the Cardinals' Albert Pujols moved from left to first when he was hampered by injuries. The Orioles' Cal Ripken Jr. shifted from short to third late in his career (after going the opposite way in his rookie season). Pete Rose progressed from second to third to first. Many prospects start out at shortstop but move to other positions as they advance up the organizational ladder. (100, "Did Derek Jeter Deserve the Gold Glove?")
There is one correction to James's original scale: Third and center should be switched. Players who played both third and center were 4.4 runs better in center than at third, one of the largest differences on the chart. Other than that, the spectrum falls into place as James originally drew it up.
Using Table 3-2.3 ["Comparative Defensive Performances"], teams could begin to break free of the constraints of positional thinking. If a team needs a new right fielder, its managers don't have to search their farm system or the free-agent market for players with experience playing right field. Instead, teams can speculate how many runs various players already on their team would gain or cost them if moved to right field. Suddenly, the number of available options increases dramatically. If a team needs an outfielder, but there are only infielders available on the free-agent market, it could sign one of the quality infielders and train an incumbent to play outfield. Using the defensive spectrum, the team would be able to better project the costs and benefits of that move as compared to signing a poorer-quality player with outfield experience. (101-2, "Did Derek Jeter Deserve the Gold Glove?")
One of the most controversial results from the sabermetric community is the lack of evidence supporting big differences in catcher defensive ability, other than differences in controlling the running games. Professionals within the game insist that catchers make a gigantic difference and that the question is simply beyond the capability of statistics to find. However, the further we look into catcher performance, the fewer places the elusive realm of catcher influence has to hide. There is no objective evidence that the catchers considered to be the best at their craft actually improve pitcher efficiency, increase strike rates, induce more misses and fouls, or do anything else to reduce batters' offensive output. If the professionals are right and the best game-callers are having some effect that statistics can't measure, we still have to ask how much offensive production a team could responsibly give up to obtain such an undetectable improvement. (110, "Is Mike Matheny a Catching Genius?")
In his record-setting 1982 season, Henderson was caught stealing 42 times, a success rate of 76 percent. Nearly a quarter of the time when he made a break for it, he left the A's in a worse situation. John Thorn and Pete Palmer addressed this issue in their seminal book The Hidden Game of Baseball, using what would later be called a "Run Expectation Table." Digging back through play-by-play data from 1961 to1977, they calculated the number of runs an average team scored in the remainder of an inning after a given baserunner-out situation. For example, with a man on first and no one out, teams scored an average of .783 runs in the rest of the inning; with a runner on second and no one out, 1.068; with no one on and one out, .249. By looking at all situations like these where teams typically attempted a stolen base. Thorn and Palmer showed that no matter how many bases players stole, if they were successful less than 63 percent of the time, they were costing their team runs.
The run-expectation tables from 1982 show that Henderson added an extra 22.2 runs to the A's offense with his 130 steals. But the 42 times he was caught cost the team 20.6 runs, meaning that for all that running, the A's gained a total of 1.6 runs for the season. In his first season, Incaviglia stole three bases and was caught twice. He cost his team about half a run. Because Henderson got caught so often, the difference between his base-stealing performance in 1982 and Incaviglia's in 1986 added up to about 2 runs. (113, "What if Rickey Henderson Had Pete Incaviglia's Legs?")
Stolen bases and times caught stealing have been tracked in box scores for decades, but nowhere is there a record of players taking the extra base.
[. . .]
Taking the extra base on a single with no one out gains a team more than 1.5 times as many runs than stealing second with no one out (0.2337). Stolen bases may get the glory in the box score, but sneaking in a few extra bases when the ball is in play is where the real money is. (116, 117, "What if Rickey Henderson Had Pete Incaviglia's Legs?")
As in run-expectation tables, the probability of scoring goes down as outs increase. However, this table reveals that there are several situations in which teams would be well advised to employ 1-run strategies. For example, having runners on first and second with no one out yields at least 1 run 61.6 percent of the 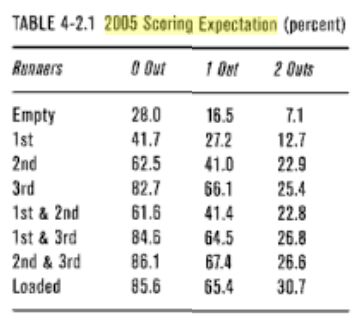 time. But if those runners are sacrificed to second and third, the scoring probability rises to 67.4 percent. Likewise, with zero or one out and men on second and third, the pitcher would reduce the chances of the opponent scoring by 0.5 percent and 2.0 percent, respectively, when he intentionally walks the next man. In the Indians' situation, sacrificing Broussard to third would have increased their scoring probability from 62.5 to 66.1 percent. So on average, sacrificing in this situation makes sense. But note that sacrificing a man from first to second never increases the likelihood of scoring at least 1 run on average. If teams are to successfully employ sacrifices to increase their chances of scoring, the sacrifice must send a runner to third base with fewer than two outs. (129, "When Is One Run Worth More Than Two?") time. But if those runners are sacrificed to second and third, the scoring probability rises to 67.4 percent. Likewise, with zero or one out and men on second and third, the pitcher would reduce the chances of the opponent scoring by 0.5 percent and 2.0 percent, respectively, when he intentionally walks the next man. In the Indians' situation, sacrificing Broussard to third would have increased their scoring probability from 62.5 to 66.1 percent. So on average, sacrificing in this situation makes sense. But note that sacrificing a man from first to second never increases the likelihood of scoring at least 1 run on average. If teams are to successfully employ sacrifices to increase their chances of scoring, the sacrifice must send a runner to third base with fewer than two outs. (129, "When Is One Run Worth More Than Two?")
Generally, having pitchers sacrifice in the National League is the correct strategy, especially considering the likelihood of their batting in front of a singles hitter. However, some pitchers who have the ability to hit above the established thresholds—such as the Marlins' Dontrelle Willis—should not sacrifice. It makes sense for non-pitchers to sacrifice only with a runner on second and no outs, only with a very small percentage of batters, and only when teams need one run. Win Expectancy and the sacrifice model show that nearly every time a team employs a non-pitcher in a sacrifice, it is reducing a chance not only to score many runs but also to score even a single run. The sacrifice is not always a bad idea, but it's vastly overused. (134-5, "When Is One Run Worth More Than Two?")
In the end, we may be forced to concede that the evaluation of managers is one area of analysis in which the numbers cannot provide any useful insight. Through a slew of different analytical techniques, no evidence of managerial influence has been found. We have seen that most managers overuse strategies like sacrifice bunts, stolen bases, and intentional walks, but it's unclear if they are the instigators or if the personnel involved escape the analysis of the Win Expectancy framework. Managers show no consistent ability to exceed their team's projected record based on runs scored and runs allowed. There is, as yet, no viable way to evaluate how a manager distributes playing time, nor does there appear to be any consistent ability to improve a team's batting performance over the course of the season. The use of either pinch hitters or relief pitchers does not reveal any skippers who show an ability to deploy their available resources better than others, and the benefit of late-inning defensive replacements is so small that attempting to find superior managers in that regard is nearly impossible. Finally, managers show no consistent ability to improve batter performance. (153-4, "Is Joe Torre a Hall of Fame Manager?")
Miller Huggins famously told his players, "You're a Yankee. Act like one." Though the word "Yankee" had no previous positive connotation of professional comportment, McCarthy proceeded to redefine it that way. It is in that realm—keeping players happy and fostering a positive atmosphere—that we must look for a manager's influence, because there is little evidence that he consistently affects the game on the field. (155, "Is Joe Torre a Hall of Fame Manager?")
Managers may earn their salaries by bringing in better players and making them want to stay. But other than that, it's difficult to see direct managerial influence on a team's performance. (156, "Is Joe Torre a Hall of Fame Manager?")
Torre's four World Series championships and his highly public position as manager of a Yankees dynasty will almost certainly get him in. But in terms of actually contributing wins on the field, the influence of managers remains clouded by auxiliary factors, hidden somewhere beneath the numbers. (156, "Is Joe Torre a Hall of Fame Manager?")
Different positions have differing offensive expectations. A shortstop's defensive responsibilities are huge, and there are very few players, even at the top of the talent pool, who are capable of fielding the position well. The number of potentially great hitters is thus reduced proportionally. This is why we see shortstops perennially hitting worse than first basemen (Miguel Tejada, Derek Jeter, and former star shortstops Alex Rodriguez and Nomar Garciaparra notwithstanding). A hitter of Mendoza's caliber could never have had a nine-year major league career playing, say, right field. While it's difficult to quantify exactly how much harder it is to play shortstop than right field, some consideration must be given to a position's defensive requirements. (159, "Why Is Mario Mendoza So Important?")
Of the new ballparks that have mushroomed across America in recent years, not one was built because it was a good business proposition. They were built because team owners saw them as a good way to obtain public cash. (226, "Are New Stadiums a Good Deal?")
There is a phrase, originally from a logician named Alfred Korzybski, that the map is not the territory. Similarly, we can say here that the statistics are not the player. A player has certain skills and attributes that he brings to the baseball diamond. They include how fast he can run, how far he can hit a baseball, whether his swing is level or an uppercut, how often he swings and misses, how well he can recognize a curveball or a slider, and his ability to recognize each particular pitcher's habits and know which pitch is coming. Those skills are his and his alone. How those skills get turned into statistics depends on a lot more than just the player. (247, "Is There Such a Thing as a Quadruple-A Player?")
A player who is older than the average player in his league appears to have an advantage. Why that is so isn't clear. It could be an advantage of experience, such as being better able to anticipate what kind of pitch will be thrown. Or it could be that emotional maturity makes him a steadier player throughout the season. Whatever it is, though, it seems to disappear when the player is promoted to the majors and has to play against people his own age.
If you were to look at two players hitting .300, one who is the correct age for his league and one who is too old, you could divide them up like this:
Young player: skill .300, experience 0
Old player: skill .270, experience .030
When these players get promoted, the experience will drop to zero for both of them, and the young player will end up outhitting the old player: Skill translates to the majors better than experience. (250, " Is There Such a Thing as a Quadruple-A Player?")
The future of platooning lies in using player characteristics that aren't already part of traditional assumptions about player performance. Rather than simple left-right platooning, teams should look into other differences like groundball-flyball, speed-power, or, as Stengel suggested long ago, different pitches. For example, Stengel would substitute a batter of the same handedness as the pitcher if he knew that batter's particular hitting ability—for instance, being able to hit a curveball or changeup—was a better predictor of performance than handedness. As he said, "If [the opposition has] a right-handed hitter who can't hit an overhanded curve ball [at bat], and you've got a right-handed pitcher in there who hasn't got an overhand curve, don't you think you might be better off with a left-hander who has?"
Baseball has never absorbed this insight, but the data to perform such analysis is now becoming available. Once it does, rather than seeing managers shuttle in an endless series of alternate-handed relievers, teams may take advantage of other platoon characteristics. Platooning and matchups are all about maximizing the resources at a team's and manager's disposal in order to gain the incremental advantages that over a long season bring a few more wins. (351, "What Does Mike Redmond Know About Tom Glavine?")
The home-field advantage in baseball is small as compared with other sports but is very consistent throughout time. Historically, the home team has won roughly an extra 4 percent of the time; about 54 percent of all baseball games are won by the home team. Thus, we add 4 percent to the win probability of whichever team is playing at home. (354, "Why Doesn't Billy Beane's Shit Work in the Playoffs?")
Since 1972, there have been twenty-seven teams that made the postseason in spite of having below-average offenses. Of these, seven won the World Series: the 1985 Royals, 1987 Twins, 1990 Reds, 1995 Braves, 1996 Yankees, 2000 Yankees, and 2005 White Sox. All of these teams, except the 1987 Twins, had excellent pitching staffs; it's hard to make the playoffs with a below-average offense unless you have an excellent pitching staff.
Conversely, twenty teams have made the postseason with below-average run prevention. None of them won the World Series, and only two (the 1982 Brewers and 1993 Phillies) even played for the championship. Sixteen of the twenty lost the first playoff series in which they played. (357-8, " Why Doesn't Billy Beane's Shit Work in the Playoffs?")
Former Oakland A's owner Charlie Finley, a notorious skinflint, once fired all his scouts and then attempted to run a successful major league organization without any semblance of a scouting department. The immediate result was that Finley, in the next two amateur drafts (1979 and 1980), would fritter away top-five picks on shortstop Juan Bustabad and pitcher Mike King, neither of whom would ever make the majors (a "feat" matched only by the top picks of the Montreal Expos in 1971 and 1972 and the Toronto Blue Jays, also in '79 and '80). This from an organization renowned for its homegrown talent base for much of the 1970s. Until recently, the Tampa Bay Devil Rays operated with an almost gleeful ignorance of basic statistical principles. The result was a club that finished in last place in seven of the eight seasons it's been in existence. With cautionary tales such as these, why would an organization not seek a way to reconcile stopwatches and spreadsheets? (369, "Can Stats and Scouts Get Along?")
Jerry Fraley of the Dallas Morning News wrote in response to Moneyball, "One good scout is worth more than 100 numbers-crunchers." Hall-of-Fame second baseman and ESPN announcer Joe Morgan on two occasions decried the book and cited Beane as its author. (In a Sports Illustrated counterpunch, Lewis quipped, "It was, in a perverse way, an author's dream: The people most upset about my book were the ones unable to divine that I had written it.") (371, " Can Stats and Scouts Get Along?")
|